i’m enjoying this week’s challenge looking at a pre-selected list of data sets and visualisation and analysing their effectiveness.
As Stuart explained, successful datasets need to be accurate, well structured and succinct. Personally, when I see a data visualisation piece of design, I want it to be a pretty immediate response, to know almost immediately what it’s about and to want to learn more and delve further into the information provided.
This week will definitely lead into next week and we need to have a critical understanding of what makes a good piece of data visualisation design and why.
It is clear enough in it’s portrayal of the data? Does it have sufficient clarity and communication? Is it effective in telling not only the information, but also a story? Did you have to work hard to understand what it was showing? Did the information present itself immediately and was it surprising? What role did Graphic Design play?
1: Florence Nightingale : Causes of Mortality

This is known as a Rose Diagram created in 1855. I am not a fan of this as I feel it’s still too much writing and wording on the page to be a succinct and informative piece. It does, however, visualise the information well in the design but it’s a lot to digest on initial viewing.
2 : Charles Minnard : Global Immigration
Again, it takes a while for this information to sink in, however before even translating the text I understood what it was about. It’s striking and I’m drawn in to look closer which is the most improtant thing – I want to know more!
3 : Accept&Proceed : Moon Landings

Very “Accept&Proceed”, definitely reminicsent of their work. I had a moment of “what even is this” and then, upon reading their website understood the concept. Once I’d read the synopsis, I was able to begin piecing together the information and I’m very drawn to it visually. It’s a great concept.
4 : Accurat and Google News Lab, WorldPOTUS

Another fab concept, the delivery of this is fantastic and it’s a really good working website. There is A LOT of info here but it’s broken down so clearly and succinctly. It’s concise in it’s design and takes you in the right direction from opening the site.
Dunn and Raby, UMK: Lives and Landscapes

A good example of a website not quite working how it should – and that gets in the way of me understanding the information being put across. There’s a lot of different language and terms being used and it’s off-putting, not to mention the amount of words being used. I gave up trying to use the map and I’m just not sure it’s successful!
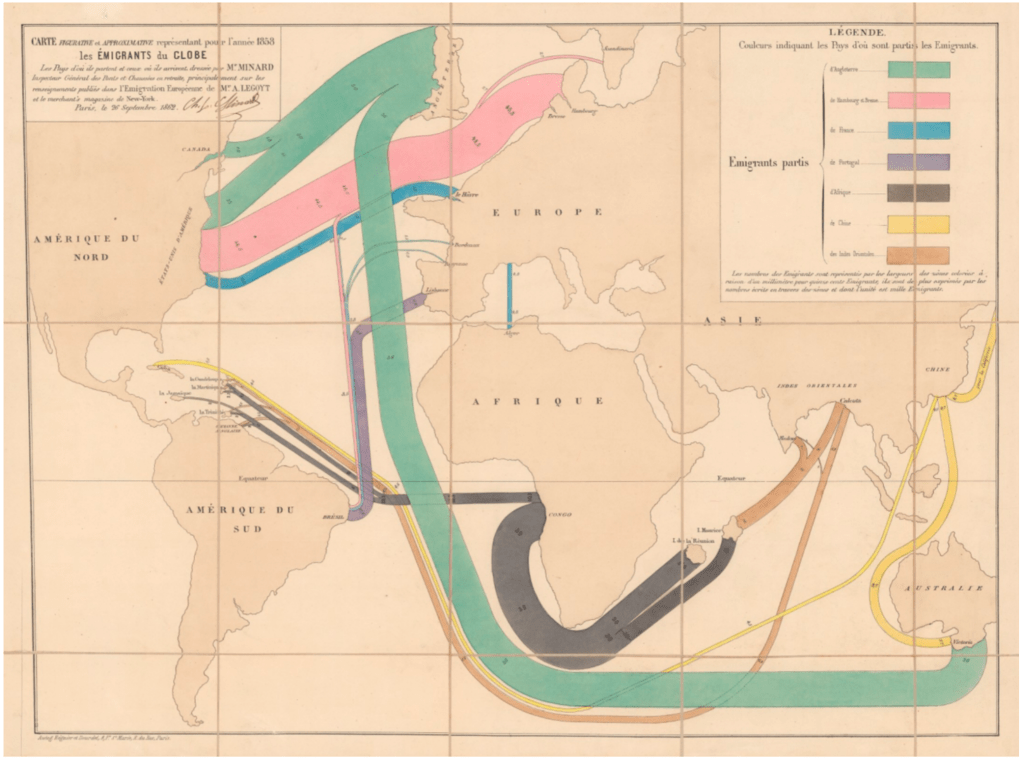
Minard’s 1858 Map of World Migration
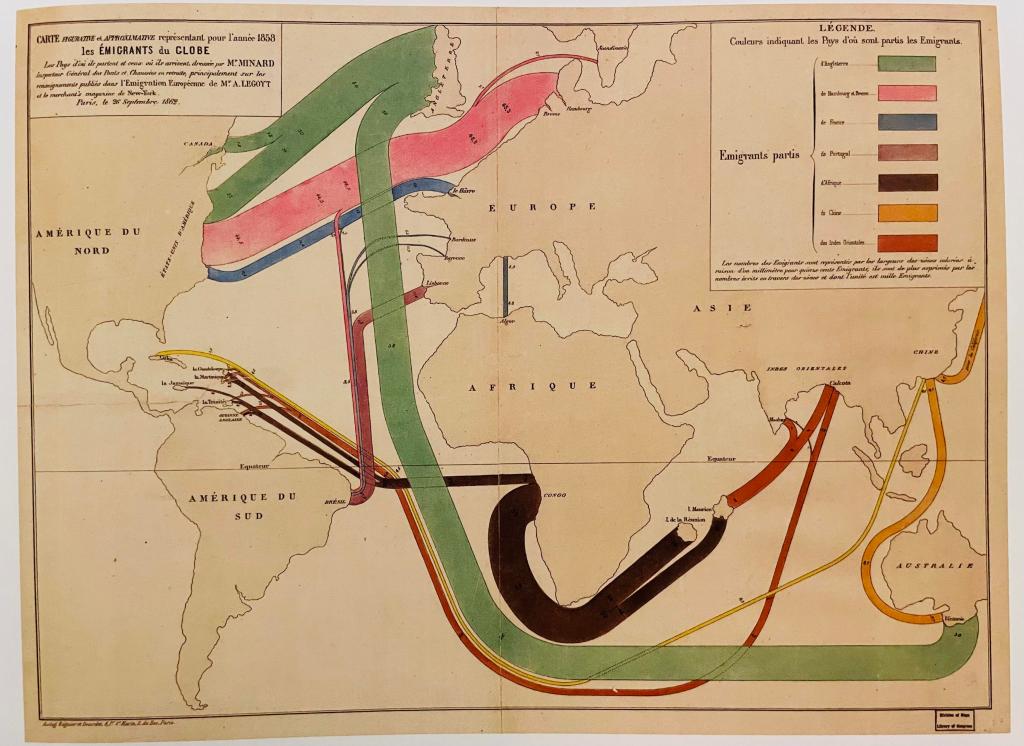
Minard was idolised for his ability to translate large numbers and complicated data sets into clear and legible infographics. His work is very reminiscent of Migrant journals in terms of the clarity of colours, flow lines and clear maps.
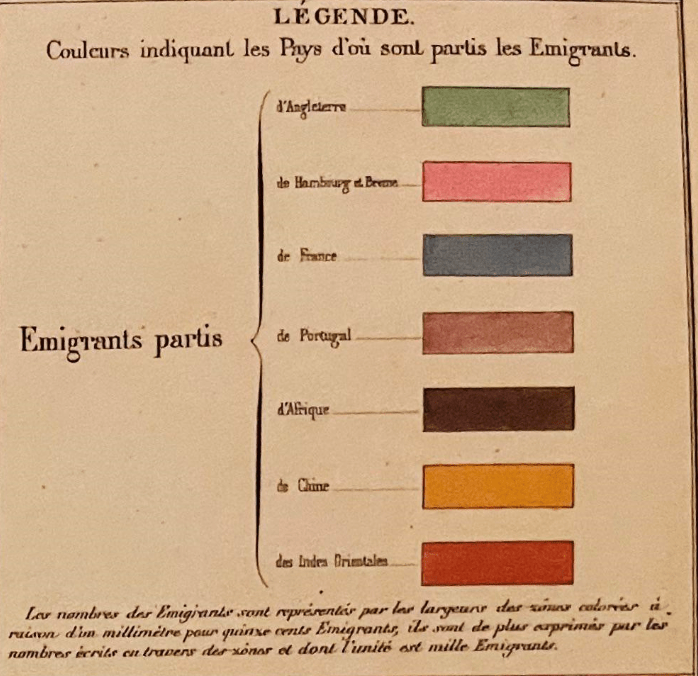
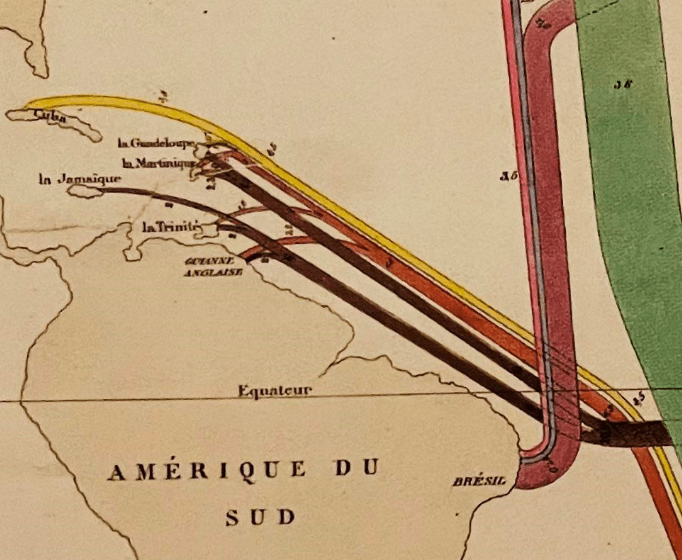
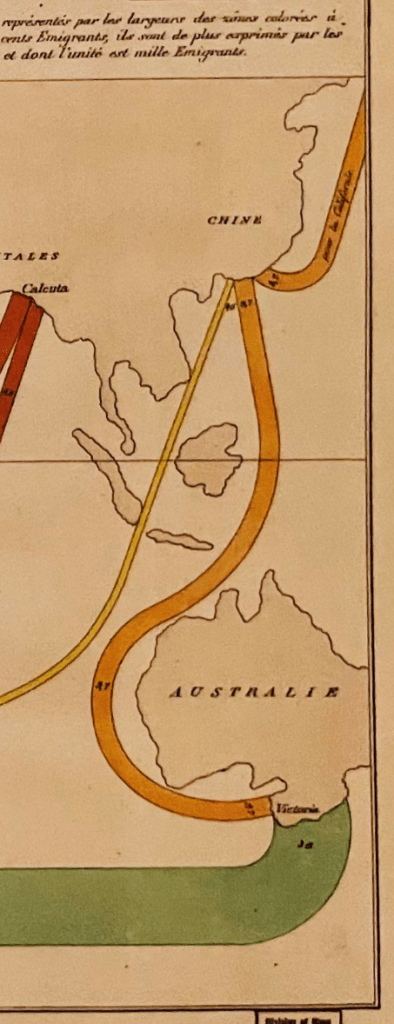
This map shows the numbers, destinations, and ports of emigrants from Europe, Africa, China and South Asia. Utilising a correlation between the thickness of the lines and the amounts of people, it is easy to immediately understand the vast amounts of people who emigrated in the year 1858. 1mm line = 1500 people.
By pulling together different lines, joining them and then pulling apart, demonstrates the flow of emigrants and enables us to realise the locations of ports.
Information Taken from the Map:
There is clear, evident mass movement to North America in 1858 and interestingly, the US, Canada and Australia still play that role today, being countries of high emigration. The clear exodus from Africa, India and China show the exchange of labourers between these colonies was still in effect. Interestingly, there is a lack of African to North American migration, however research has shown that North America banned the import of foreign slaves in 1808.
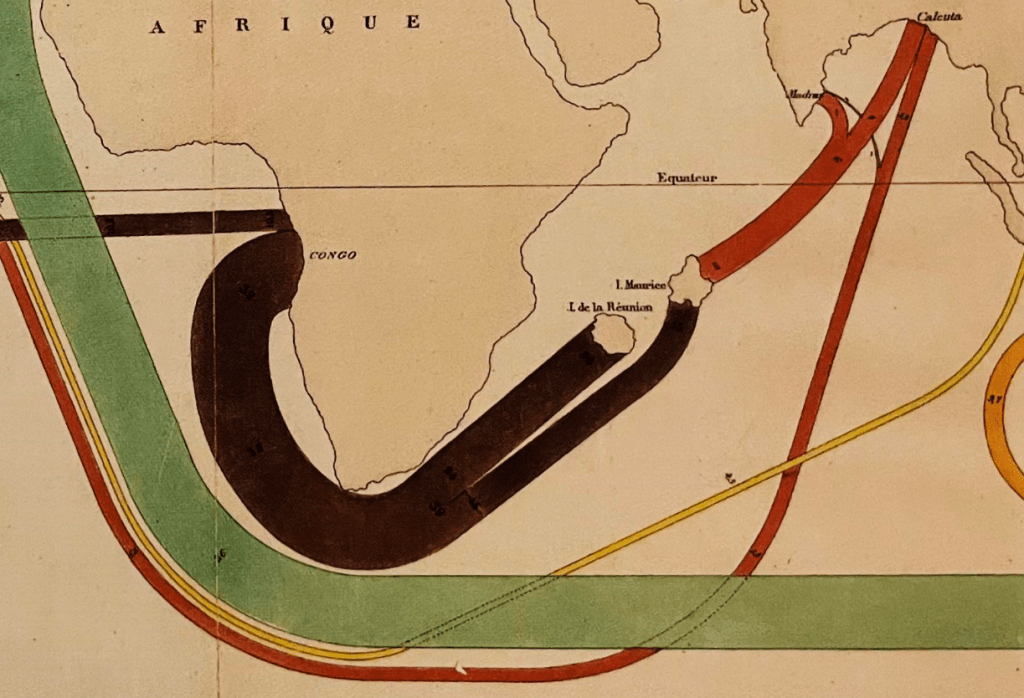

The African to European colonies emigration is clear also on this map, from Africa to the Indian Ocean Islands of Reunion (French) and Mauritius (English) represent the labour needed to run the sugar plantations there. The thinner lines suggest African labour was still flowing to the Caribbean islands of Guadeloupe, Martinique, Jamaica, Trinidad, and Guyana. The size of the lines help in understanding that three times as many Africans were taken to Mauritius and Reunion as went to French and British territories in the Caribbean.
Design features:
Minard utilised clean, simplistic lines to demonstrate the outlines of the countries, however there is a clear discrepancy between the outlines of the continents as North America and Australia and Europe are all too disproportionately large. Minard was known for his accuracy so it’s unsure how this came about, but perhaps it was in order for the lines across the Atlantic to be clearer and easier to read. As was seen with the London Underground, the maps don’t necessarily need to be completely accurate, as long as it’s clear.
In order for the map to be clear, instead of utilising more lines to demonstrate the exact locations of the departures, he’s used the most popular ports to ensure lines are not skewed or overpowering. Slimming down the amount of information shown is vital to ensure clarity.
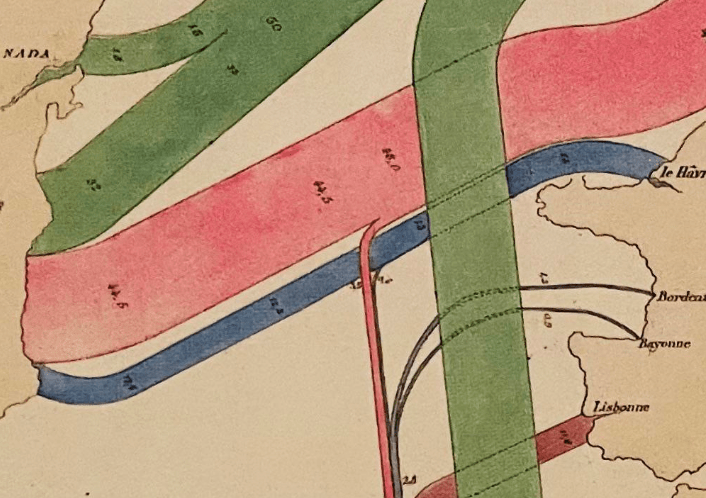
I found his use of flow lines interesting, usually these get smaller and larger depending on the amount represented, which is the case here, but there are clear moments when lines get smaller or larger, demonstrating ports and areas of interchange with other emigrants. By using divergent lines, Minard clearly shows the flow of immigration from the major ports of Europe and Asia.
Take, for example, the Chinese emigration lines – one running to Australia, joining the line from England. One line running across the Atlantic to the Caribbean and the other towards California. These different lines demonstrate the different movements from one country and the number of different ports.
It’s clear that both accuracy and design played vital parts in the creation of this map, in keeping the design simplistic and not necessarily accurate, Minard was able to clearly and accurately show the migration in 1858.
There has, however, been controversy regarding his choice of colours and sizes of the countries/continents. Upon researching more into this, there appears to be a belief that the innaccuracy of this map perhaps hints at his inherent bias at the time (1862) and the tendencies of that time to try and reinforce the colonial behaviours that we now have the ability to look back on and find offensive. However, I don’t believe we can look at this map and believe there is an underlying bias in what was created – Minard worked with data, not opinions. Perhaps he was more focussed on data and the visualisation of this data than create a meaning behind it.
(527 Words)
Editorial Design

I decided to utilise these beautiful coloured flow lines that are the highlight of this piece of work – I separated the individual lines and manipulated them to use as a background for my editorial design on indesign:
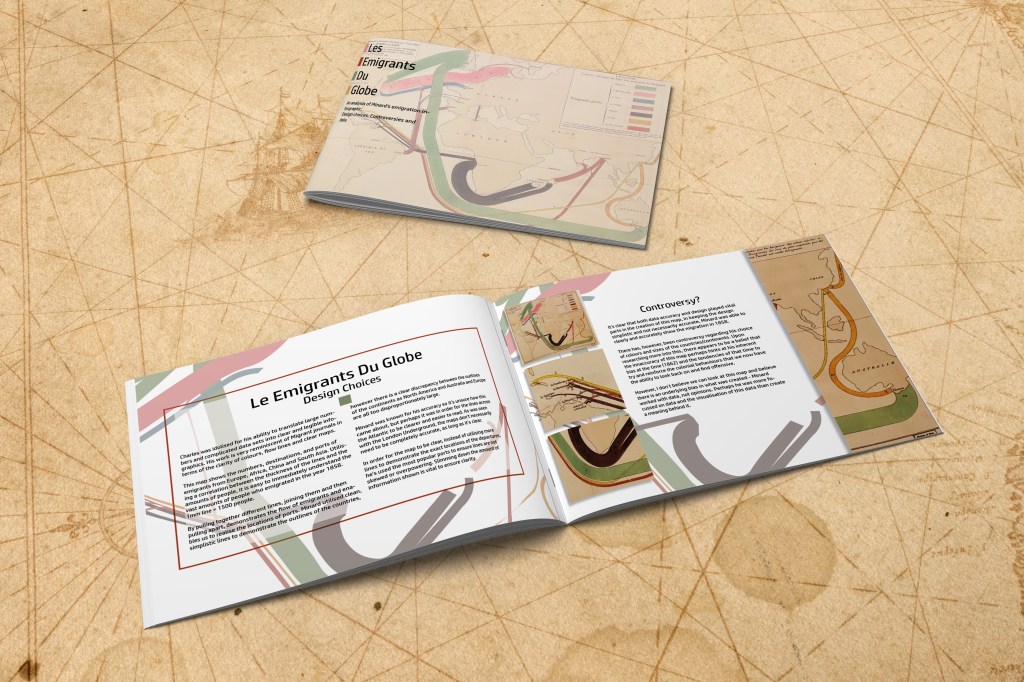
I wanted to keep the font rather minimalistic and simplified as I was utilising the coloured lines as a background which in itself is quite busy.
Bibliography
Data Visual.blog. (2020). The making of “The Emigrants of the World, 1858, Charles Minard” map in Tableau. [online] Available at: https://datavisual.blog/2020/08/21/the-making-of-the-emigrants-of-the-world-1858-charles-minard-map-in-tableau/ [Accessed 9 Feb. 2021].
What We Can Learn From a Vintage Visualization of Global Migration. (2014). Bloomberg.com. [online] 11 Nov. Available at: https://www.bloomberg.com/news/articles/2014-11-11/what-we-can-learn-from-a-vintage-visualization-of-global-migration [Accessed 9 Feb. 2021].
Cartographia. (2008). Minard on Immigration. [online] Available at: https://cartographia.wordpress.com/2008/05/12/minard-on-immigration/ [Accessed 9 Feb. 2021].
phineas (n.d.). Minard’s 1858 Map of World Migration – Sankey Diagrams. [online] Available at: http://www.sankey-diagrams.com/minards-1858-map-of-world-migration/ [Accessed 9 Feb. 2021].
thoughtbot. (2014). Analyzing Minard’s Visualization Of Napoleon’s 1812 March. [online] Available at: https://thoughtbot.com/blog/analyzing-minards-visualization-of-napoleons-1812-march.
